Vacancies statistic
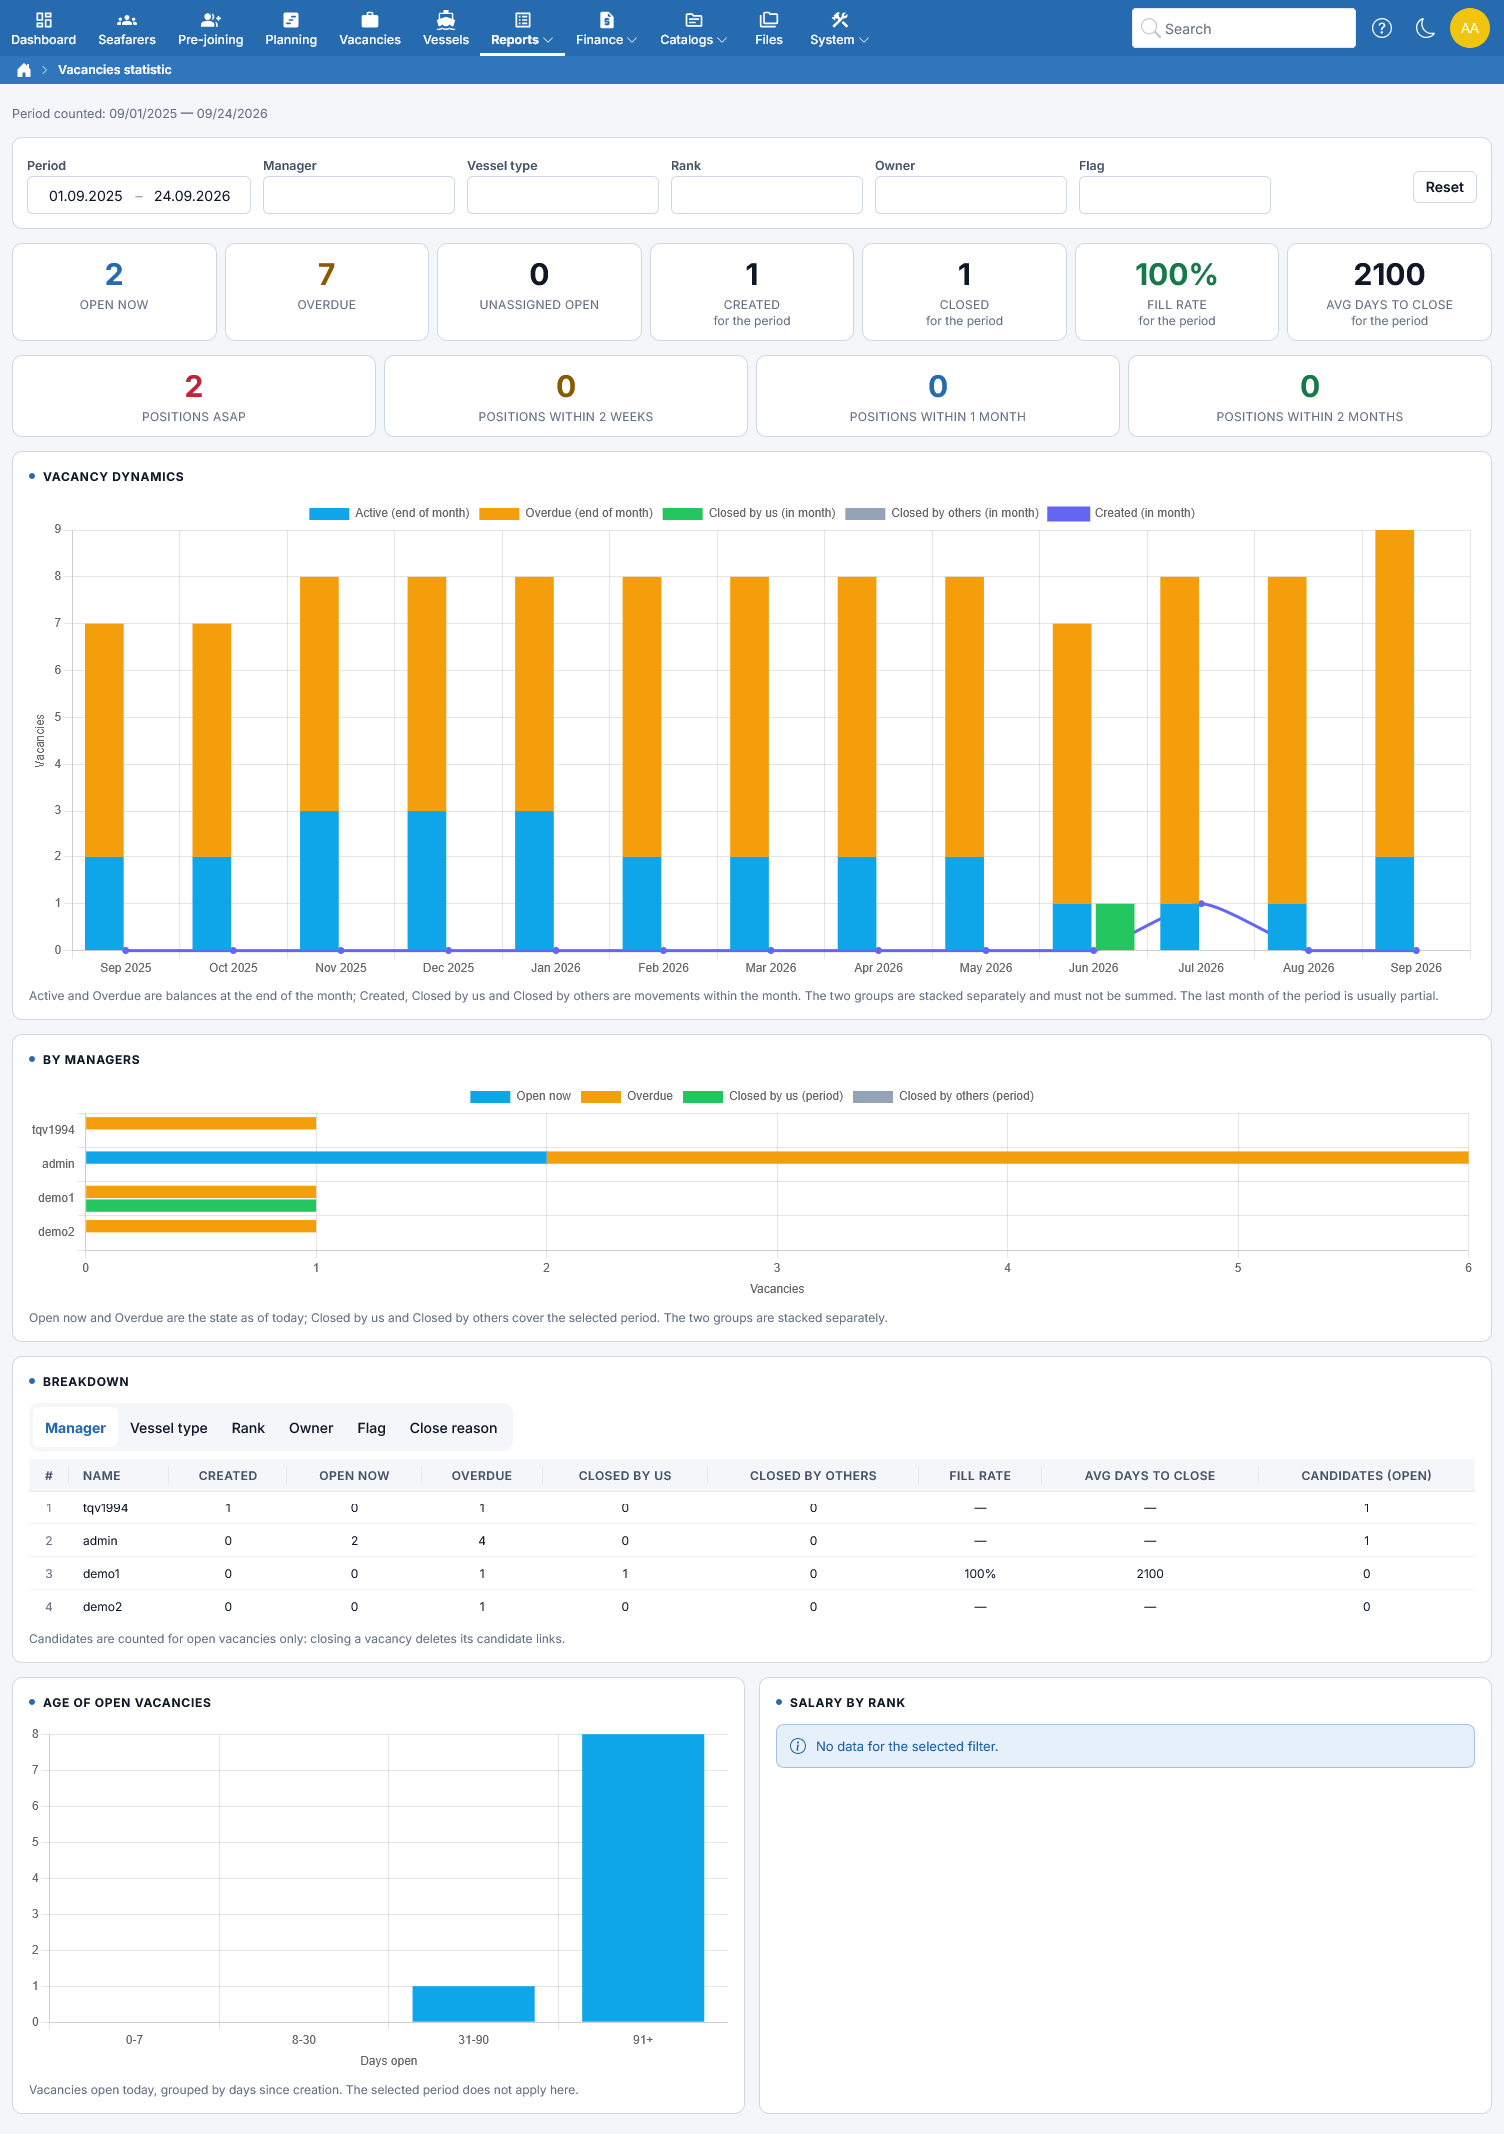
This report shows how your vacancies move over time: how many are open, how many go overdue, how many get closed, who closes them, and how long it takes. Open it from Reports → Statistic → Vacancies statistic.
Use it to answer questions such as: is the backlog of open positions growing or shrinking? Which manager closes the most vacancies, and how fast? Which vessel types or ranks are hardest to fill?
Vacancy statuses used in this report
The report uses the same statuses as the Vacancies list, plus a split of the closed ones:
| Status | Meaning |
|---|---|
| Open now | The vacancy is not closed and its joining date is still ahead (or the vacancy is marked as joining as soon as possible). Shown as Active in the vacancies list. |
| Overdue | The vacancy is not closed, but its joining date has already passed. Shown as Inactive in the vacancies list. |
| Closed by us | The vacancy was closed with Hired through us = Yes — you filled the position. |
| Closed by others | The vacancy was closed with Hired through us = No — it was cancelled, covered by someone else, or left unfilled. See Closing a vacancy. |
Fill rate is the share of closed vacancies that were closed by us. If ten vacancies were closed in the period and seven of them with Hired through us = Yes, the fill rate is 70%.
Filter
The filters apply to the report except the Open positions by joining date counters described below:
- Period — the date range the report counts. By default it covers the last twelve months plus the current one.
- Manager, Vessel type, Rank, Owner, Flag — narrow the report down to one manager, vessel type, rank, shipowner or flag.
Reset clears everything back to the default period.
The line Period counted next to the page title always shows the range actually used.
The start of the period is moved back to the first day of its month, so the first month on the chart is always a whole one. The end of the period is counted as you set it, which usually makes the last month partial — a half-finished month naturally looks lower than the ones before it.
Manager means the manager assigned to the vacancy. If no one is assigned, the vacancy is counted for the person who created it.
Summary
A row of tiles with the headline numbers:
- Open now, Overdue, Unassigned open — the state of your vacancies today. These three ignore the selected period.
- Created, Closed, Fill rate, Avg days to close — activity inside the selected period. Average days to close is counted from the day a vacancy was created to the day it was closed.
Open positions by joining date
These four counters replace the former Open vacancies dashboard widget. They count vacancies that are not closed, grouped by joining date relative to today:
| Counter | Joining date |
|---|---|
| Positions ASAP | No joining date; joining as soon as possible. |
| Positions within 2 weeks | Today through 14 days from today. |
| Positions within 1 month | After 14 days, up to one calendar month from today. |
| Positions within 2 months | After one month, up to two calendar months from today. |
The groups do not overlap. Past joining dates and dates more than two months ahead are excluded. These counters show company-wide totals and ignore all report filters, including Period and Manager.
Vacancy dynamics
A monthly chart with two groups of bars:
- Active (end of month) and Overdue (end of month) — how many vacancies stood in each status on the last day of that month.
- Closed by us (in month) and Closed by others (in month) — how many vacancies were closed during that month. Created (in month) is drawn as a line.
The two groups answer different questions and are stacked separately. A balance at the end of the month and the movements within that month must never be added together.
By managers
A bar chart comparing managers: how many vacancies each has open and overdue today, and how many they closed within the period, split into closed by us and closed by others.
Breakdown
One table with a switch above it. Choose what to group the vacancies by:
Manager, Vessel type, Rank, Owner, Flag, Close reason.
The columns stay the same for every grouping:
| Column | Meaning |
|---|---|
| Name | The group — a manager, a vessel type, a rank, and so on. |
| Created | Vacancies created within the period. |
| Open now / Overdue | Current state, regardless of the period. |
| Closed by us / Closed by others | Vacancies closed within the period. |
| Fill rate | Share of closed vacancies that were closed by us. |
| Avg days to close | Average number of days from creation to closing. |
| Candidates (open) | Candidates linked to the group's open vacancies. |
Candidates are counted for open vacancies only. Closing a vacancy removes its candidate links, so closed vacancies always show no candidates — including the whole Close reason grouping, which by definition contains closed vacancies only.
The Close reason grouping uses the text entered in the closing dialog. Reasons are matched regardless of letter case, but two differently worded reasons stay two separate rows — pick your wording consistently, or use the suggestions offered in the dialog, if you want this grouping to stay readable.
Age of open vacancies
A chart of the vacancies that are open today, grouped by how many days have passed since they were created: 0–7, 8–30, 31–90 and 91+ days. It shows how much of your backlog has been sitting unfilled for a long time.
The selected period does not apply to this block — it always describes the situation today.
Salary by rank
A table of the average salary range offered per rank: Rank, Currency, Vacancies, Avg salary from, Avg salary up to.
Vacancies created within the selected period are counted. Vacancies with a contractual wage, and those without a lower salary bound, are left out — there is no range to average.
Each currency gets its own row and amounts are never converted between currencies, so a rank with offers in both USD and EUR appears twice. Compare rows within one currency only.